

Managing hundreds of Kubernetes clusters can make incident response a significant challenge for enterprise SRE teams. At Coderise, we built an AI SRE Agent that automatically investigates alerts, gathers logs, metrics, and traces, performs root cause analysis, and provides evidence-backed remediation suggestions. When an alert fires, an SRE engineer shouldn’t have to spend the first...
SRE Incident Response Runbook for Cloud-Native Teams
A practical SRE incident response runbook for cloud-native teams, covering roles, severity, communication, mitigation, and postmortems.
Observability vs Monitoring: What Engineering Teams Need
A practical explanation of observability vs monitoring for engineering teams building and operating cloud-native applications.
LLM Evaluation Framework: How to Test AI Apps Before Launch
A practical LLM evaluation framework for testing AI applications before launch with golden data, automated checks, review, and release gates.
How to Monitor LLM Apps: Logs, Traces, Evals, and Alerts
Learn how to monitor LLM applications with logs, traces, evaluations, feedback loops, cost metrics, latency tracking, and actionable alerts.
How to Reduce OpenAI API Costs in Production
A practical guide to lowering OpenAI API costs in production without wrecking quality, reliability, or the user experience.
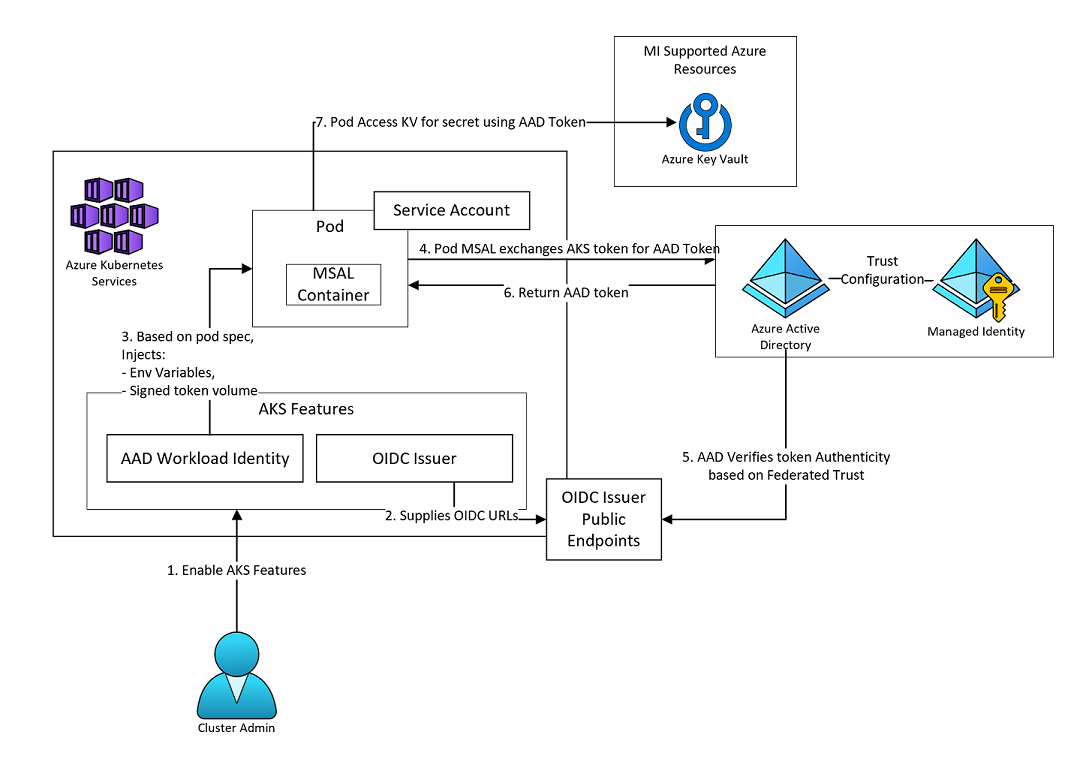
Secrets Management in AKS with Azure Workload Identity
aks secrets store csi driver
Managing secrets across dozens of websites and APIs in Azure Kubernetes Service (AKS) can be a nightmare if you’re still using static credentials. Hardcoded secrets, long-lived keys, and manual rotations increase the risk of exposure and slow down deployments. On Azure Kubernetes Service (AKS), we’ve evolved with the Secrets Store CSI Driver, Azure Key Vault,...
Monitoring with Kubernetes

Ingress Amazon EKS
Introduction: In previous blogs, we have explored the Azure Container Service and Kubernetes. In this blog, we will explore the monitoring with Kubernetes. Prerequisite: Running Kubernetes Cluster Kubectl utility For reliable applications, it is required to have in place monitoring of the Kubernetes Cluster. It helps to determine availability, scalability, and reliability of the...
Prometheus: Setting up Monitoring and Alerting for Application

Introduction: Prometheus is the open source monitoring solution which gives powerful metrics and alerts. When to use? Time Series Data: It works well for numeric time series data. Multidimensional Data: If the organization follows Microservice architecture, Prometheus is a great tool to monitor multi-dimensional data. Machine Centric Monitoring: It is used for the machine-centric monitoring...